P1Monitor
Lately I’ve been playing around with P1Monitor to connect to my smart meter at home, measuring both gas and electricity usage. Here in The Netherlands we have a standard for that communication that’s also adopted in other countries: DSMR. The P1-Monitor app, which normally is distributed as a SDCard image for RaspberryPi use, connects to the USB port (you need a cable like this one) and reads the telegrams the meter transmits on it’s serial port.
P1Monitor in Docker
Because I’m running other things on my Pi4 (DNS, NextCloud, Plausible etc), I wanted to have the P1Monitor packaged as a Docker image. Some alternatives exist, but I decided to package my own version and publish it. You can find it here. It’ll give you a fully functioning P1Monitor, running in Docker. I’ve compiled for arm and x86, so you have free platform choice.
You can run the container in the following way:
docker run -d -p 80:80 -p 10721:10721 -p 40721:40721 --name="p1mon" \
-h p1mon --cap-add=SYS_NICE \
--tmpfs /tmp --tmpfs /run --tmpfs /p1mon/mnt/ramdisk \
-v /<insert local path>/p1mon/data:/p1mon/data:rw -v /<insert local path>/p1mon/usbdisk:/p1mon/mnt/usb:rw \
-v /etc/localtime:/etc/localtime:ro \
--device=/dev/<your USB device> \
--restart=unless-stopped \
rvleij/p1monitor
P1Monitor -> Home-Assistant
I then use MQTT to publish events based on the data received from the meter by defining sensors in Home-Assiststants configuration.yaml:
# Sensorssensor:
    - platform: mqtt
    state_topic: "p1monitor/smartmeter/consumption_kw"
    name: consumption
    unit_of_measurement: kW
    device_class: power
  - platform: mqtt
    state_topic: "p1monitor/smartmeter/consumption_kwh_high"
    name: usage high
    unit_of_measurement: kWh
    device_class: energy
  - platform: mqtt
    state_topic: "p1monitor/smartmeter/consumption_kwh_low"
    name: usage low
    unit_of_measurement: kWh
    device_class: energy
  - platform: mqtt
    state_topic: "p1monitor/phase/l1_a"
    name: current
    unit_of_measurement: A
    device_class: current
  - platform: mqtt
    state_topic: "p1monitor/phase/l1_v"
    name: voltage
    unit_of_measurement: V
    device_class: voltage
  - platform: mqtt
    state_topic: "p1monitor/smartmeter/consumption_gas_m3"
    name: gas
    unit_of_measurement: m3
Home-Assistant -> InfluxDB
And then to get things into InfluxDB (I’m running v2), I use:
influxdb:
  host: <your influx IP>
  port: 8086
  api_version: 2
  token: <your token>
  ssl: false
  organization: <your org in case of influxV2>
  max_retries: 10
  bucket: home_assistant/autogen
  tags:
    source: HA
  tags_attributes:
    - friendly_name
  include:
    entities:
       - sensor.voltage
       - sensor.current
       - sensor.consumption
       - sensor.gas
       - sensor.usage_low
       - sensor.usage_high
Now the only thing needed is the grafana dashboard, which I created (basic I know) like this:
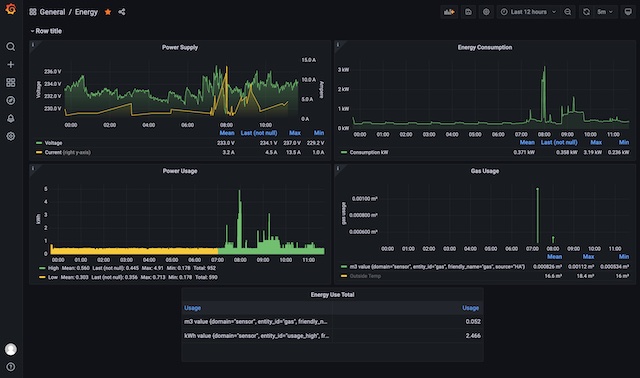
and that’s really it, now the only things left for future improvement on the roadmap are to investigate the new power dashboard in Home-Assistant and figure out how to fix the labels after migrating to Influxv2!